AWS Cost Optimization Dashboard
Developed a custom cost tracking dashboard for a mid-size company using Lambda, CloudWatch, S3, and DynamoDB. Automatically pulls billing data and visualizes AWS usage trends for stakeholders.
7/16/20252 min read

🧾 Introduction
As businesses grow in the cloud, so do their bills — often without clear visibility. That’s what prompted this project: to build a custom AWS Cost Optimization Dashboard that would help a mid-size company better understand, manage, and reduce their cloud expenses.
Instead of relying solely on the AWS Cost Explorer console (which can be complex and limited in automation), I built a fully serverless dashboard that automatically gathers cost data, summarizes it, and presents it in a user-friendly visual format.
🎯 Project Goals
Automate cost and usage data collection from AWS
Track daily, weekly, and monthly costs by service and region
Store reports in DynamoDB and S3 for querying and archival
Present insights in a visual dashboard for finance and engineering teams
Provide a foundation for tagging compliance and resource rightsizing
🔄 Data Collection
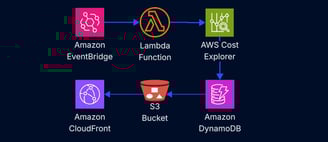
A scheduled CloudWatch Event (EventBridge rule) triggers a Lambda function daily at midnight.
The AWS Cost Explorer API is used to query:
Daily spend
Service-level breakdown
Region-level costs
Tag-level groupings (e.g., environment, project)
The Lambda function stores:
Summaries in DynamoDB (for fast querying)
Detailed reports in S3 as timestamped JSON files
🧠 Backend Logic: Lambda + Cost Explorer
The Python-based Lambda function:
Assumes a billing-permitted IAM role
Queries cost data for the past 24 hours
Calculates:
Total daily cost
Cost per service
Top 5 regions by spend
Saves summaries to DynamoDB
Uploads full datasets to S3
📊 Frontend Dashboard
The dashboard is:
Static (HTML/CSS/JS)
Hosted on S3 + CloudFront
Uses Chart.js for data visualization
Loads and filters cost data client-side via AJAX
Users can:
Filter costs by date or service
View top-spending services or regions
Track cost trends over time — without logging into the AWS console
🔐 Security Highlights
Lambda IAM role scoped strictly to Cost Explorer and DynamoDB
S3 bucket encrypted at rest with versioning
CloudFront adds SSL/TLS and optional geo restrictions
Access to the dashboard can be limited via signed URLs or IP restrictions
🏢 Real-World Impact
For the mid-size company I built this for:
It gave finance and engineering shared visibility into daily AWS costs
Exposed idle or underutilized resources
Supported better tagging enforcement and chargeback
Encouraged engineers to think in terms of cost per service, not just total bill
Now, the dashboard is reviewed weekly by engineering leads to identify savings.
🎓 Lessons Learned
Gained hands-on experience with AWS Cost Explorer API
Built a real-time, serverless analytics tool
Transformed complex billing data into actionable insights
Strengthened collaboration between DevOps and Finance teams
✅ Conclusion
This project gave the company real-time visibility into cloud spending and helped shift from reactive cost management to proactive optimization. It also showed how powerful AWS-native tools can be when combined effectively — no third-party tools required.
🛠️ Tech Stack
AWS Lambda
AWS Cost Explorer API
Amazon DynamoDB
Amazon S3
Amazon CloudWatch
Amazon EventBridge
Amazon CloudFront
Chart.js (frontend)